 portop
 Web dashboard
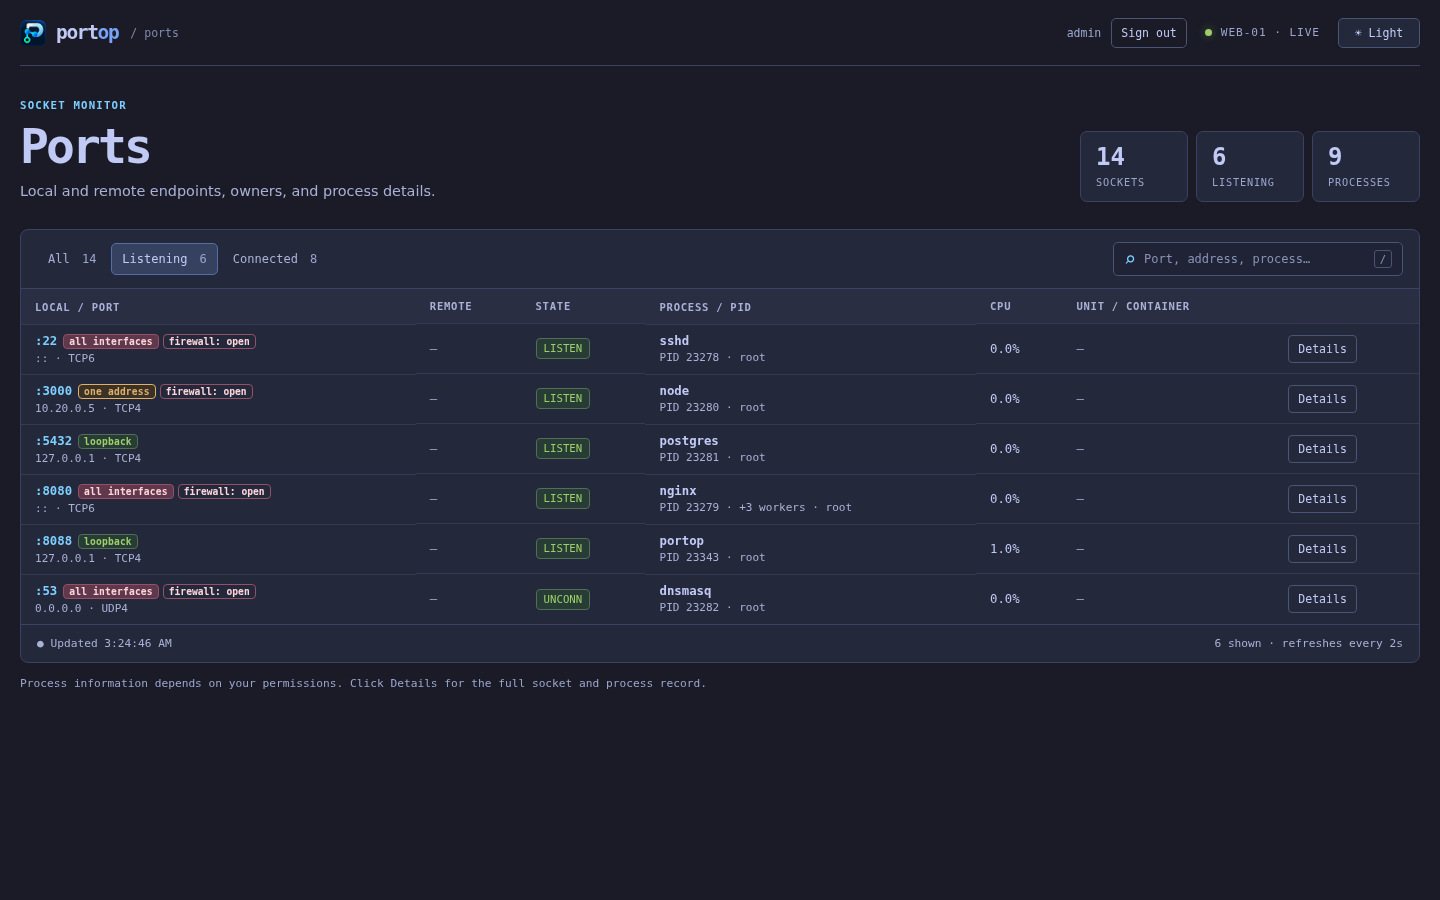
The same live view in a browser, with process details and confirmed SIGTERM and SIGKILL.
Start
portop --web                  # http://127.0.0.1:8088
portop --web --web-port 9090
The dashboard lists every socket with its exposure and firewall badges, user, workers and traffic, with tabs for listening and connected sockets and a search box. The printed URL carries a per-run token: without it the table is readable, but process details and signals are refused. --listen, the --no-* flags and a filter apply here too.
Sign-in
| Option | Meaning |
|---|---|
--web-auth | Require sign-in; without a password, one is generated and printed |
--web-user NAME | Username (default portop); implies --web-auth |
PORTOP_WEB_PASSWORD | Password from the environment |
--web-password PASS | Password on the command line, visible to other local users in ps |
Sessions last 12 hours and end when portop stops. After five failed sign-ins a client, an IPv4 address or an IPv6 /64, waits a minute. Process actions also need a per-session token, so another site cannot use a signed-in cookie.
Remote access and TLS
Only a dashboard with sign-in may listen beyond loopback:
openssl req -x509 -newkey ec -pkeyopt ec_paramgen_curve:P-256 -nodes -days 365 \
  -subj "/CN=$(hostname)" -keyout portop.key -out portop.crt
PORTOP_WEB_PASSWORD='choose-one' portop --web --web-user admin \
  --web-addr 0.0.0.0:8088 --web-tls-cert portop.crt --web-tls-key portop.key
Without TLS the password crosses the network unencrypted; portop warns about it. An SSH tunnel to a loopback dashboard needs no certificate: ssh -L 8088:127.0.0.1:8088 host.
Prometheus metrics
/metrics serves the Prometheus text format:
| Metric | Labels |
|---|---|
portop_sockets | protocol, state |
portop_listening_ports | protocol, scope |
portop_listening_port_info | protocol, port, address, scope, firewall, process, pid, user, container (value always 1) |
portop_scrape_duration_seconds |
With sign-in enabled, /metrics accepts the dashboard credentials as HTTP Basic auth:
scrape_configs:
  - job_name: portop
    scheme: https
    basic_auth:
      username: admin
      password: choose-one
    static_configs:
      - targets: ["host:8088"]
Alert when portop_listening_ports{scope="all"} grows, or on a new portop_listening_port_info series.